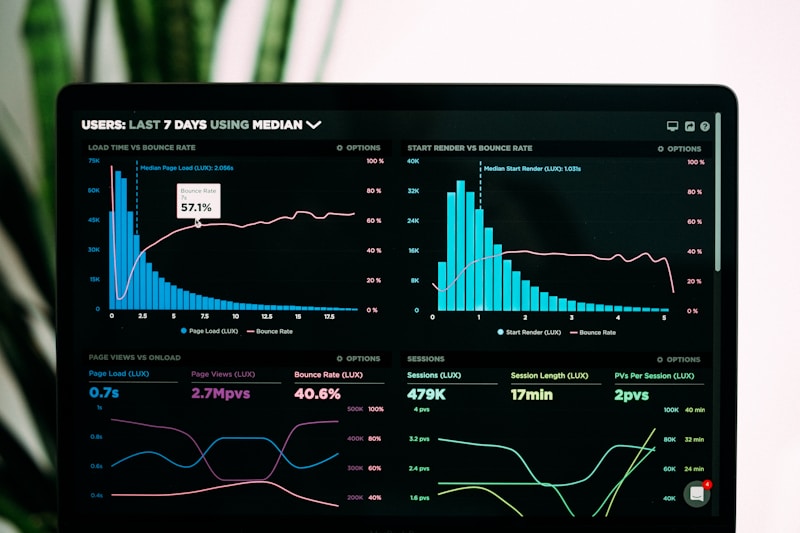
Why Inventory Reporting Matters
You can't improve what you don't measure. Inventory reporting transforms raw data into actionable insights that drive better decisions and improved performance.
Zentracka's built-in dashboards provide real-time visibility into key metrics. Start your free trial to access powerful reporting.
Essential Inventory KPIs
Inventory Turnover Ratio
How often you sell through inventory annually. Higher is generally better, indicating efficient stock management.
Days Sales of Inventory (DSI)
Average days to sell inventory. Lower DSI means faster turns and less capital tied up.
Stockout Rate
Percentage of orders affected by stockouts. Target less than 2% for most industries.
Carrying Cost Percentage
Annual cost to hold inventory as percentage of value. Typically 20-30% including storage, insurance, and opportunity cost.
Inventory Accuracy
System count vs. physical count accuracy. World-class operations achieve 99%+.
Building Effective Dashboards
Great inventory dashboards follow these principles:
- Focus on actionable metrics
- Show trends, not just snapshots
- Enable drill-down to details
- Highlight exceptions and alerts
Zentracka's customizable dashboards let you build views for different roles.
Report Types You Need
Operational Reports
- Stock level summary
- Low stock alerts
- Reorder recommendations
- Receiving/shipping activity
Financial Reports
- Inventory valuation
- COGS analysis
- Margin by product
- Carrying cost breakdown
Performance Reports
- Turnover by category
- Slow-moving inventory
- Supplier performance
- Forecast accuracy
Automating Report Delivery
Schedule reports to stakeholders automatically:
- Daily stock summaries to warehouse
- Weekly performance to management
- Monthly financials to accounting
Zentracka's scheduled reports deliver insights automatically.
Ready for better visibility? Start your free trial. Compare reporting features or contact us for custom analytics needs.